
Advanced Usage#
This page covers some of the more advanced configurations for Lattice and Stream.
Process background lines#
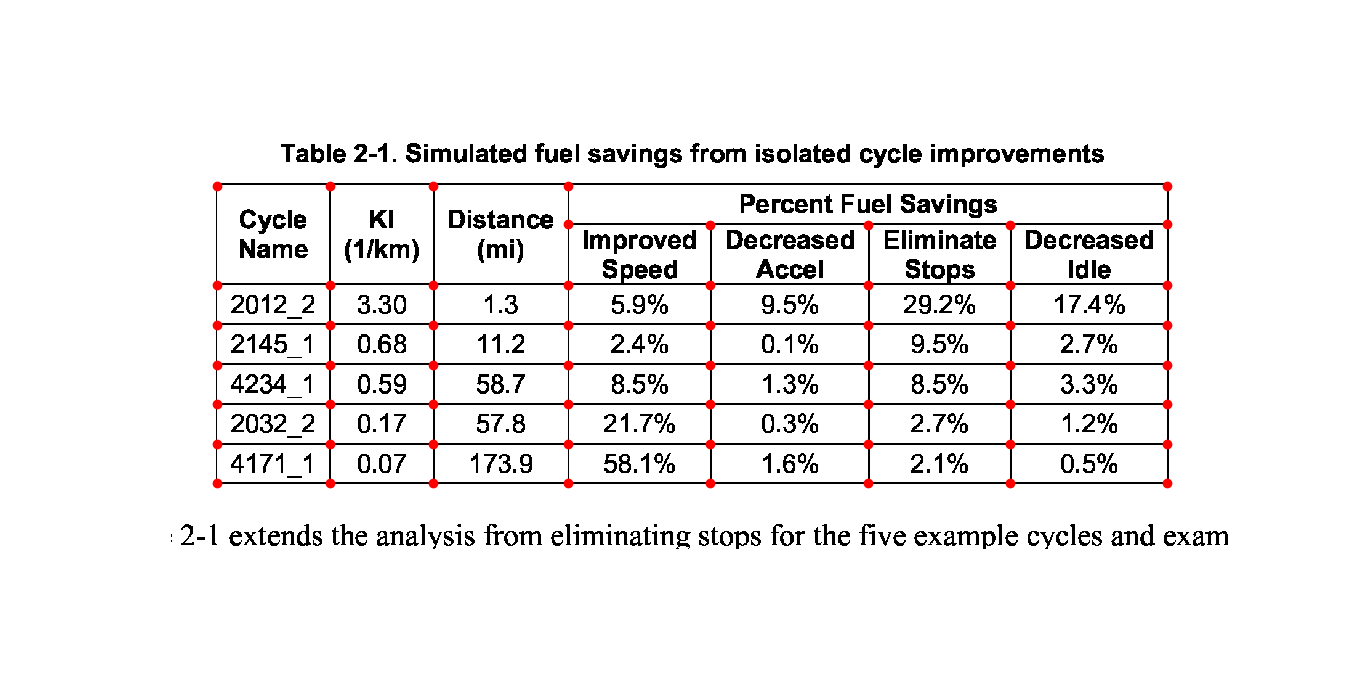
To detect line segments, Lattice needs the lines that make the table to be in the foreground. Here’s an example of a table with lines in the background:
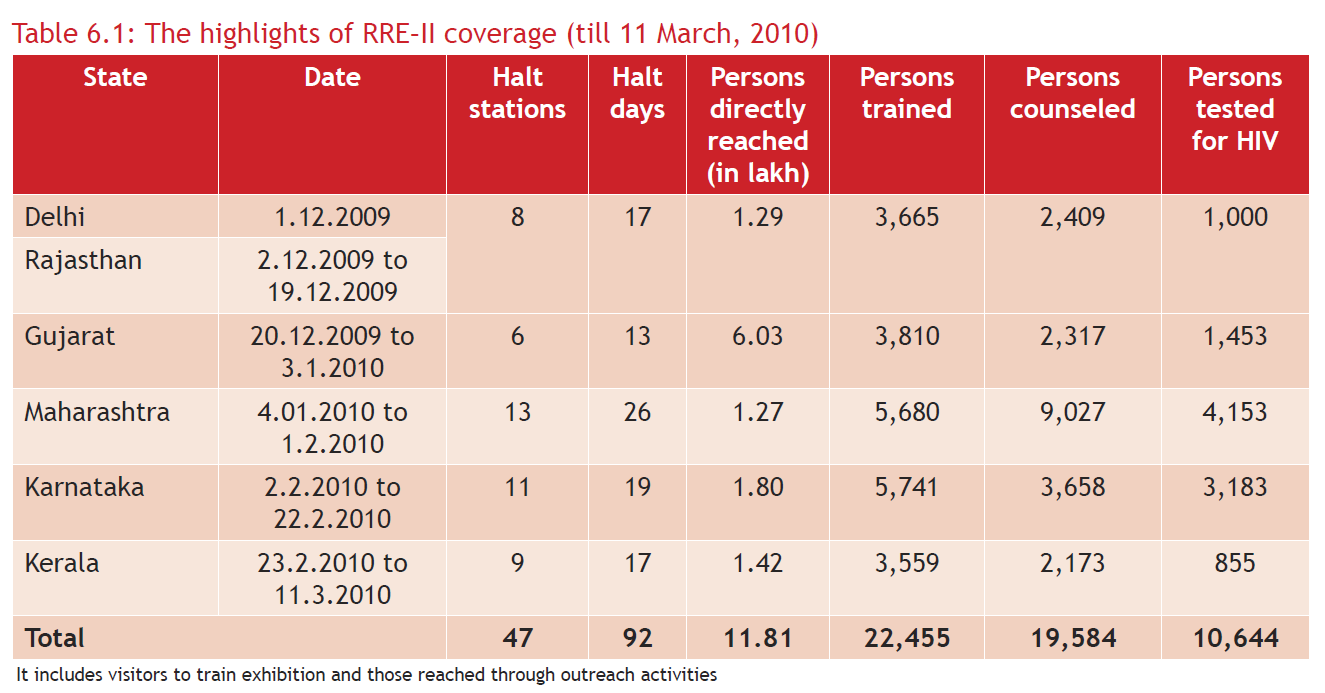
Source: PDF
To process background lines, you can pass process_background=True.
>>> tables = camelot.read_pdf('background_lines.pdf', process_background=True)
>>> tables[1].df
Tip
Here’s how you can do the same with the command-line interface.
$ camelot lattice -back background_lines.pdf
State |
Date |
Halt stations |
Halt days |
Persons directly reached(in lakh) |
Persons trained |
Persons counseled |
Persons testedfor HIV |
Delhi |
1.12.2009 |
8 |
17 |
1.29 |
3,665 |
2,409 |
1,000 |
Rajasthan |
2.12.2009 to 19.12.2009 |
||||||
Gujarat |
20.12.2009 to 3.1.2010 |
6 |
13 |
6.03 |
3,810 |
2,317 |
1,453 |
Maharashtra |
4.01.2010 to 1.2.2010 |
13 |
26 |
1.27 |
5,680 |
9,027 |
4,153 |
Karnataka |
2.2.2010 to 22.2.2010 |
11 |
19 |
1.80 |
5,741 |
3,658 |
3,183 |
Kerala |
23.2.2010 to 11.3.2010 |
9 |
17 |
1.42 |
3,559 |
2,173 |
855 |
Total |
47 |
92 |
11.81 |
22,455 |
19,584 |
10,644 |
Bridge gaps in ruled lines#
When a Lattice-flavoured PDF’s table is drawn with ruled lines that don’t quite meet at corners (a common artefact of older scanned-then-redrawn forms), the detected grid drops the affected rows or columns. The iterations keyword argument dilates the line mask to close those gaps — but dilation alone also thickens every line, which in turn pushes the outer ruled lines outward and adds spurious extra rows above and below the real table.
Pair it with the new erode_iterations keyword to perform a morphological closing (dilate then erode of equal count): gaps are bridged without changing the line mask’s overall size, so the detected grid stays right.
>>> # Bridges line gaps without thickening
>>> tables = camelot.read_pdf(
...     'broken_lines.pdf',
...     flavor='lattice',
...     iterations=1,
...     erode_iterations=1,
... )
erode_iterations defaults to 0 (fully backward-compatible with the long-standing dilate-only behaviour). Bump it together with iterations only when you’ve confirmed the legacy behaviour leaves phantom rows around your table.
Line-detection engine: raster, combined, auto#
By default Lattice finds a table’s ruled lines by rasterising the page (rendering it to an image) and detecting lines with OpenCV. That works well for scanned or image-based tables, but a PDF that draws its rules as native vector graphics carries the exact line coordinates already — and those rules sometimes render faintly or anti-aliased, so the rasteriser misses them.
The engine keyword lets you choose how lines are detected:
'raster'(default) — OpenCV on the rendered page. The long-standing behaviour.'combined'— run raster detection and union in the ruled lines read straight from the PDF’s vector graphics before the grid is reconstructed. A table whose rules are vector strokes is then found even when it renders faintly.'auto'— use'combined'when the page actually carries vector ruled lines, otherwise fall back to'raster'.'vector'— detect tables purely from the PDF’s vector ruled lines, skipping rasterisation entirely. The fastest engine (no page render, no OpenCV), for PDFs whose tables are drawn with real vector strokes. A page with no vector ruled lines yields no tables, so prefer'auto'/'combined'for mixed documents.
>>> # Recover a faintly-ruled vector table that 'raster' misses
>>> tables = camelot.read_pdf(
...     'vector_ruled.pdf',
...     flavor='lattice',
...     engine='combined',
... )
'combined' is safe to try on any lattice PDF: raster detection always runs first, so the vector lines can only add to what was found, never remove it. On a PDF whose rules the rasteriser already detects cleanly, engine='combined' returns exactly the same tables as engine='raster'.
The same keyword works with flavor='hybrid', where it drives the lattice half of the hybrid parser:
>>> tables = camelot.read_pdf(
...     'mixed_layout.pdf',
...     flavor='hybrid',
...     engine='combined',
... )
Filter out noise tables#
Detection sometimes returns small or low-quality “tables” — a stray single
cell, a mostly-empty region, a heading mistaken for a 1x1 grid. TableList.filter() keeps only the tables that pass the thresholds you give and returns a new TableList; extraction itself is unchanged.
>>> tables = camelot.read_pdf('noisy.pdf')
>>> # keep tables with at least 2 rows and 2 columns
>>> real = tables.filter(min_rows=2, min_columns=2)
>>> # …or filter on parsing quality, and compose freely
>>> good = tables.filter(min_accuracy=90).filter(max_whitespace=50)
Every threshold defaults to a no-op (min_rows=1, min_columns=1,
min_accuracy=0, max_whitespace=100), so a legitimate single-row or
single-column table is never dropped unless you ask for it. accuracy and
whitespace are the same 0–100 values reported in
Table.parsing_report.
Visual debugging#
Note
Visual debugging using plot() requires matplotlib which is an optional dependency. You can install it using $ pip install camelot-py[plot].
You can use the plot() method to generate a matplotlib plot of various elements that were detected on the PDF page while processing it. This can help you select table areas, column separators and debug bad table outputs, by tweaking different configuration parameters.
You can specify the type of element you want to plot using the kind keyword argument. The generated plot can be saved to a file by passing a filename keyword argument. The following plot types are supported:
‘text’
‘grid’
‘contour’
‘line’
‘joint’
‘textedge’
Let’s generate a plot for each type using this PDF as an example. First, let’s get all the tables out.
>>> tables = camelot.read_pdf('foo.pdf')
>>> tables
<TableList n=1>
text#
Let’s plot all the text present on the table’s PDF page.
>>> camelot.plot(tables[0], kind='text').show()
Tip
Here’s how you can do the same with the command-line interface.
$ camelot lattice -plot text foo.pdf
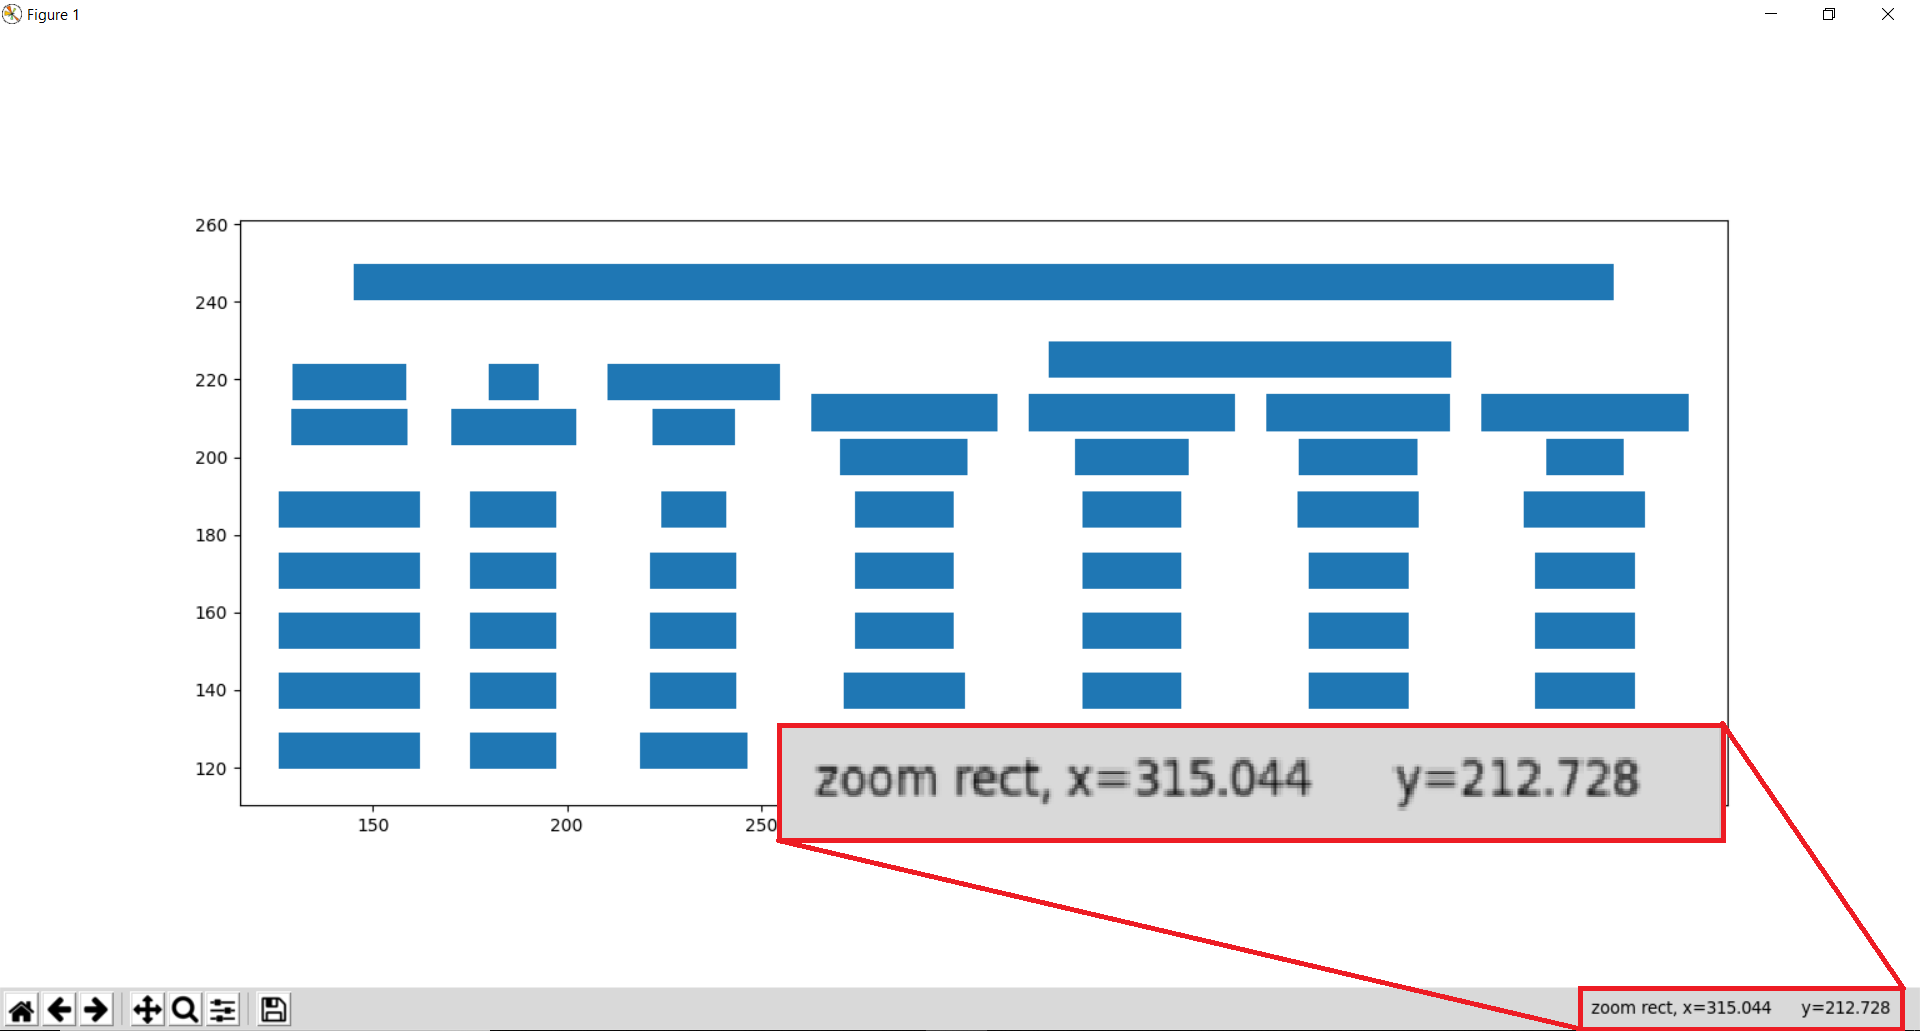
This, as we shall later see, is very helpful with Stream for noting table areas and column separators, in case Stream does not guess them correctly.
Note
The x-y coordinates shown above change as you move your mouse cursor on the image, which can help you note coordinates.
table#
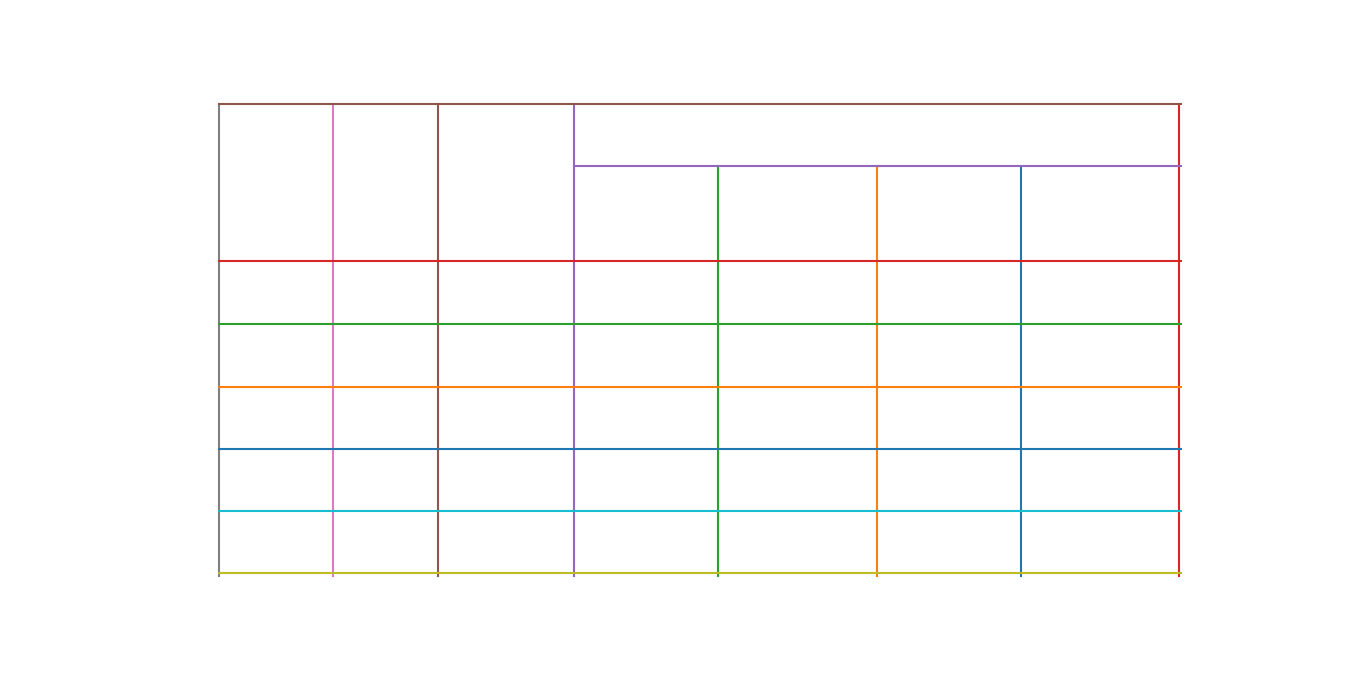
Let’s plot the table (to see if it was detected correctly or not). This plot type, along with contour, line and joint is useful for debugging and improving the extraction output, in case the table wasn’t detected correctly. (More on that later.)
>>> camelot.plot(tables[0], kind='grid').show()
Tip
Here’s how you can do the same with the command-line interface.
$ camelot lattice -plot grid foo.pdf
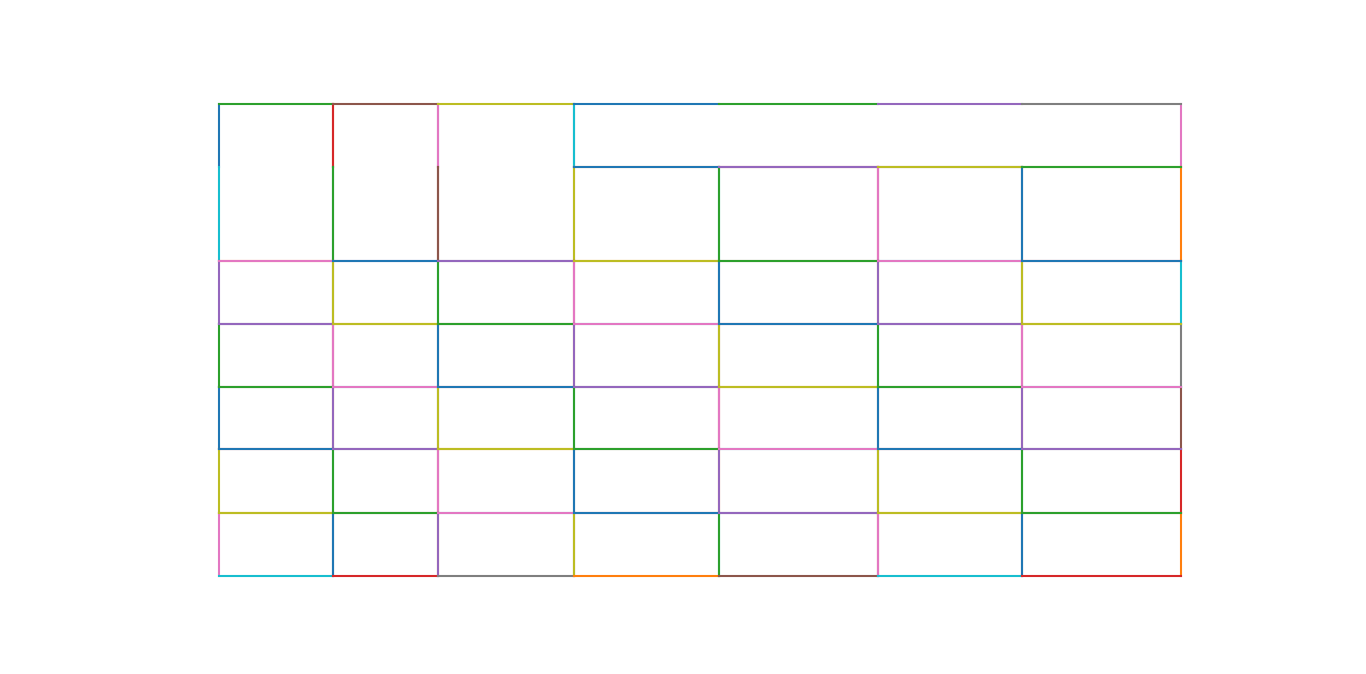
The table is perfect!
contour#
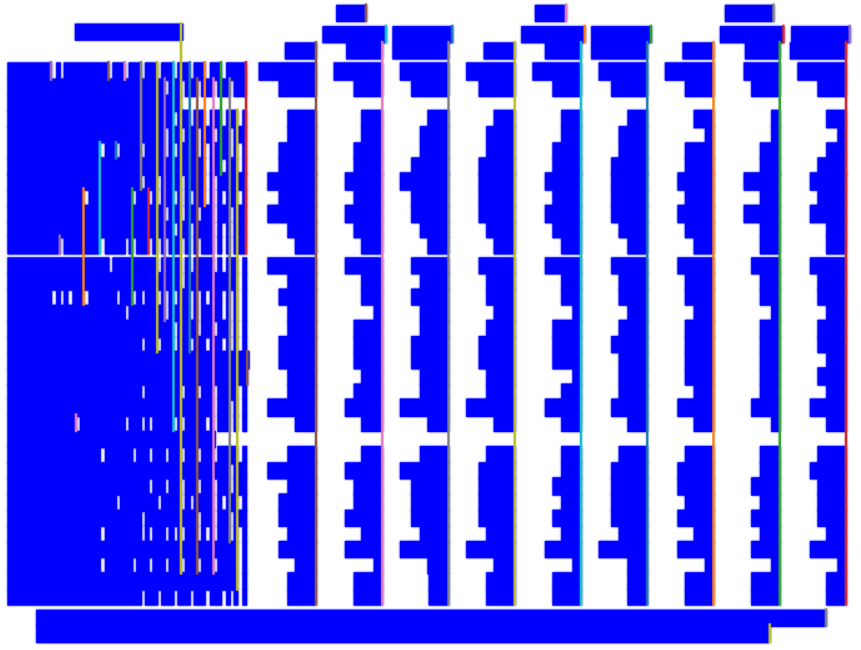
Now, let’s plot all table boundaries present on the table’s PDF page.
>>> camelot.plot(tables[0], kind='contour').show()
Tip
Here’s how you can do the same with the command-line interface.
$ camelot lattice -plot contour foo.pdf
line#
Cool, let’s plot all line segments present on the table’s PDF page.
>>> camelot.plot(tables[0], kind='line').show()
Tip
Here’s how you can do the same with the command-line interface.
$ camelot lattice -plot line foo.pdf
joint#
Finally, let’s plot all line intersections present on the table’s PDF page.
>>> camelot.plot(tables[0], kind='joint').show()
Tip
Here’s how you can do the same with the command-line interface.
$ camelot lattice -plot joint foo.pdf
textedge#
You can also visualize the textedges found on a page by specifying kind='textedge'. To know more about what a “textedge” is, you can see pages 20, 35 and 40 of Anssi Nurminen’s master’s thesis:
>>> camelot.plot(tables[0], kind='textedge').show()
Tip
Here’s how you can do the same with the command-line interface.
$ camelot stream -plot textedge foo.pdf
Specify table areas#
In cases such as these, it can be useful to specify exact table boundaries. You can plot the text on this page and note the top left and bottom right coordinates of the table.
Table areas that you want camelot to analyze can be passed as a list of comma-separated strings to read_pdf(), using the table_areas keyword argument.
>>> tables = camelot.read_pdf('table_areas.pdf', flavor='stream', table_areas=['316,499,566,337'])
>>> tables[0].df
Tip
Here’s how you can do the same with the command-line interface.
$ camelot stream -T 316,499,566,337 table_areas.pdf
One Withholding |
|
Payroll Period |
Allowance |
Weekly |
$71.15 |
Biweekly |
142.31 |
Semimonthly |
154.17 |
Monthly |
308.33 |
Quarterly |
925.00 |
Semiannually |
1,850.00 |
Annually |
3,700.00 |
Daily or Miscellaneous |
14.23 |
(each day of the payroll period) |
Note
table_areas accepts strings of the form x1,y1,x2,y2 where (x1, y1) -> top-left and (x2, y2) -> bottom-right in PDF coordinate space. In PDF coordinate space, the bottom-left corner of the page is the origin, with coordinates (0, 0).
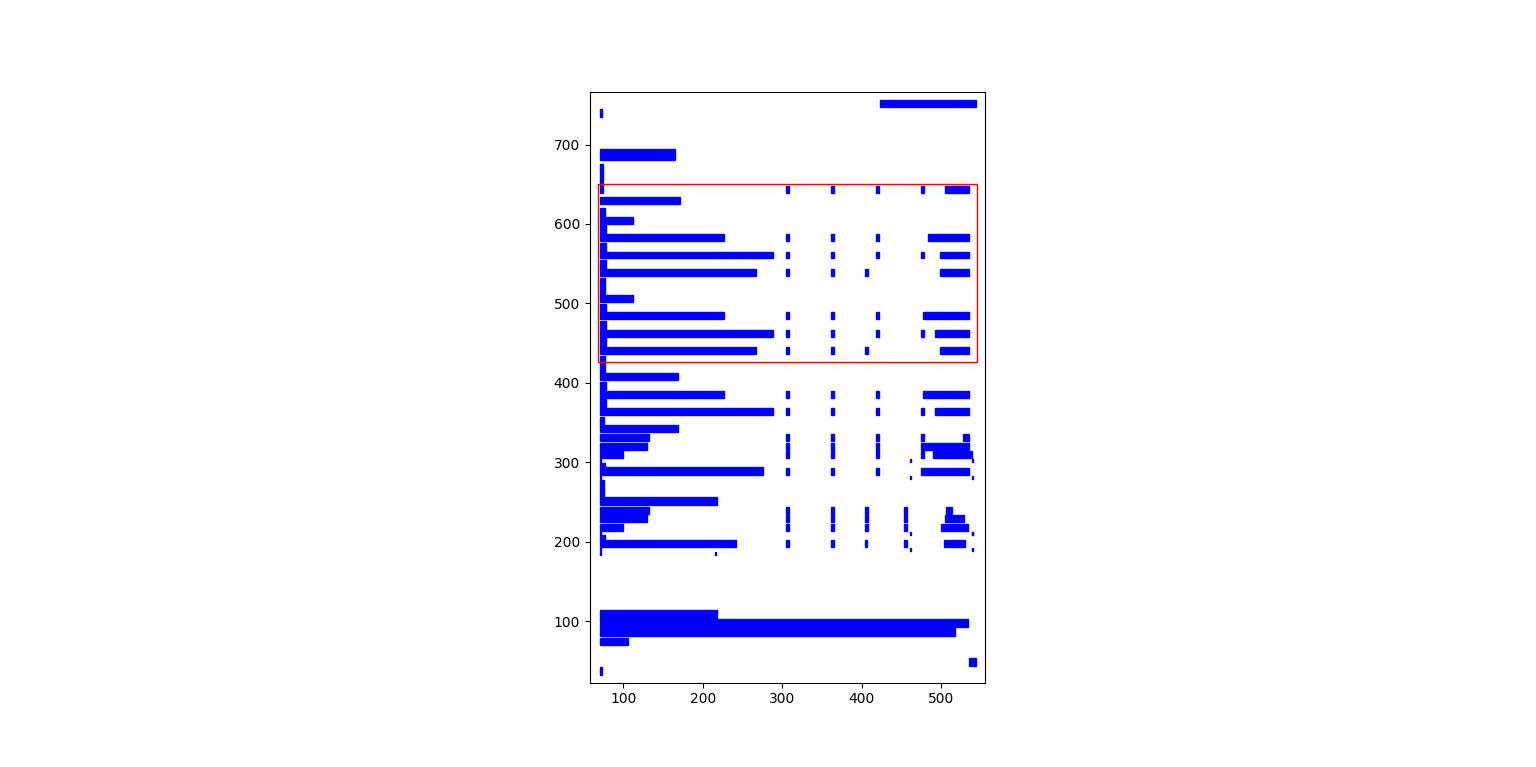
Specify table regions#
However there may be cases like [1] and [2], where the table might not lie at the exact coordinates every time but in an approximate region.
You can use the table_regions keyword argument to read_pdf() to solve for such cases. When table_regions is specified, camelot will only analyze the specified regions to look for tables.
>>> tables = camelot.read_pdf('table_regions.pdf', table_regions=['170,370,560,270'])
>>> tables[0].df
Tip
Here’s how you can do the same with the command-line interface.
$ camelot lattice -R 170,370,560,270 table_regions.pdf
Età dell’Assicuratoall’epoca del decesso |
Misura % dimaggiorazione |
18-75 |
1,00% |
76-80 |
0,50% |
81 in poi |
0,10% |
Specify column separators#
In cases like these, where the text is very close to each other, it is possible that camelot may guess the column separators’ coordinates incorrectly. To correct this, you can explicitly specify the x coordinate for each column separator by plotting the text on the page.
You can pass the column separators as a list of comma-separated strings to read_pdf(), using the columns keyword argument.
In case you passed a single column separators string list, and no table area is specified, the separators will be applied to the whole page. When a list of table areas is specified and you need to specify column separators as well, the length of both lists should be equal. Each table area will be mapped to each column separators’ string using their indices.
For example, if you have specified two table areas, table_areas=['12,54,43,23', '20,67,55,33'], and only want to specify column separators for the first table, you can pass an empty string for the second table in the column separators’ list like this, columns=['10,120,200,400', ''].
Let’s get back to the x coordinates we got from plotting the text that exists on this PDF, and get the table out!
>>> tables = camelot.read_pdf('column_separators.pdf', flavor='stream', columns=['72,95,209,327,442,529,566,606,683'])
>>> tables[0].df
Tip
Here’s how you can do the same with the command-line interface.
$ camelot stream -C 72,95,209,327,442,529,566,606,683 column_separators.pdf
… |
… |
… |
… |
… |
… |
… |
… |
… |
… |
LICENSE |
PREMISE |
||||||||
NUMBER TYPE DBA NAME |
LICENSEE NAME |
ADDRESS |
CITY |
ST |
ZIP |
PHONE NUMBER |
EXPIRES |
||
… |
… |
… |
… |
… |
… |
… |
… |
… |
… |
Ah! Since playa (the PDFMiner-compatible layout engine Camelot now uses) merged the strings, “NUMBER”, “TYPE” and “DBA NAME”, all of them were assigned to the same cell. Let’s see how we can fix this in the next section.
Split text along separators#
To deal with cases like the output from the previous section, you can pass split_text=True to read_pdf(), which will split any strings that lie in different cells but have been assigned to a single cell (as a result of being merged together by playa, the PDFMiner-compatible layout engine).
>>> tables = camelot.read_pdf('column_separators.pdf', flavor='stream', columns=['72,95,209,327,442,529,566,606,683'], split_text=True)
>>> tables[0].df
Tip
Here’s how you can do the same with the command-line interface.
$ camelot -split stream -C 72,95,209,327,442,529,566,606,683 column_separators.pdf
… |
… |
… |
… |
… |
… |
… |
… |
… |
… |
LICENSE |
PREMISE |
||||||||
NUMBER |
TYPE |
DBA NAME |
LICENSEE NAME |
ADDRESS |
CITY |
ST |
ZIP |
PHONE NUMBER |
EXPIRES |
… |
… |
… |
… |
… |
… |
… |
… |
… |
… |
Flag superscripts and subscripts#
There might be cases where you want to differentiate between the text and superscripts or subscripts, like this PDF.
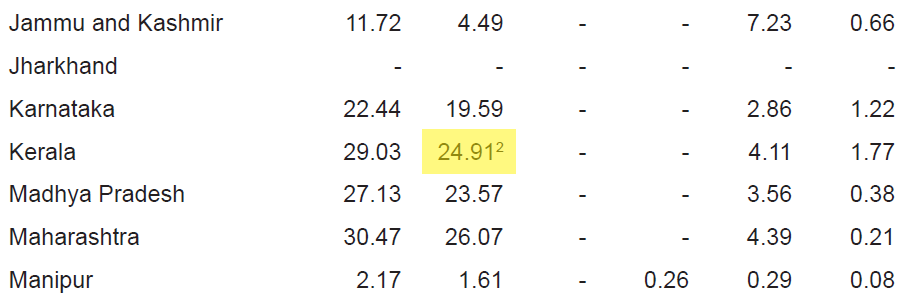
In this case, the text that other tools return, will be 24.912. This is relatively harmless when that decimal point is involved. But when it isn’t there, you’ll be left wondering why the results of your data analysis are 10x bigger!
You can solve this by passing flag_size=True, which will enclose the superscripts and subscripts with <s></s>, based on font size, as shown below.
>>> tables = camelot.read_pdf('superscript.pdf', flavor='stream', flag_size=True)
>>> tables[0].df
Tip
Here’s how you can do the same with the command-line interface.
$ camelot -flag stream superscript.pdf
… |
… |
… |
… |
… |
… |
… |
… |
… |
… |
… |
Karnataka |
22.44 |
19.59 |
2.86 |
1.22 |
0.89 |
0.69 |
||||
Kerala |
29.03 |
24.91<s>2</s> |
4.11 |
1.77 |
0.48 |
1.45 |
||||
Madhya Pradesh |
27.13 |
23.57 |
3.56 |
0.38 |
1.86 |
1.28 |
||||
… |
… |
… |
… |
… |
… |
… |
… |
… |
… |
… |
Strip characters from text#
You can strip unwanted characters like spaces, dots and newlines from a string using the strip_text keyword argument. Take a look at this PDF as an example, the text at the start of each row contains a lot of unwanted spaces, dots and newlines.
>>> tables = camelot.read_pdf('12s0324.pdf', flavor='stream', strip_text=' .\n')
>>> tables[0].df
Tip
Here’s how you can do the same with the command-line interface.
$ camelot -strip ' .\n' stream 12s0324.pdf
… |
… |
… |
… |
… |
… |
… |
… |
… |
… |
Forcible rape |
17.5 |
2.6 |
14.9 |
17.2 |
2.5 |
14.7 |
– |
– |
– |
Robbery |
102.1 |
25.5 |
76.6 |
90.0 |
22.9 |
67.1 |
12.1 |
2.5 |
9.5 |
Aggravated assault |
338.4 |
40.1 |
298.3 |
264.0 |
30.2 |
233.8 |
74.4 |
9.9 |
64.5 |
Property crime |
1,396 .4 |
338 .7 |
1,057 .7 |
875 .9 |
210 .8 |
665 .1 |
608 .2 |
127 .9 |
392 .6 |
Burglary |
240.9 |
60.3 |
180.6 |
205.0 |
53.4 |
151.7 |
35.9 |
6.9 |
29.0 |
… |
… |
… |
… |
… |
… |
… |
… |
… |
… |
The strip_text argument also accepts a list or tuple of substrings, in which case each whole substring is removed wherever it appears (rather than each individual character). This is the right mode when you want to strip multi-character markers like footnote references without nicking lone brackets / digits elsewhere in the cell:
>>> # Per-character (long-standing behaviour): strips any of '[', ']', '1', '2'
>>> camelot.read_pdf('doc.pdf', strip_text='[12]')

>>> # Per-substring (new in 2.0): strips only the literal markers '[1]' and '[2]',
>>> # leaves stray '[' or ']' alone.
>>> camelot.read_pdf('doc.pdf', strip_text=['[1]', '[2]'])
Replace text in cells#
Where strip_text can only remove characters or substrings, replace_text lets you rewrite them. It accepts a dict mapping substrings to their replacements, applied to every cell’s text just before assignment.
A common motivating example: words that PDF text extraction has split across a soft line break end up concatenated without a space. Use replace_text to turn “ n” (space + newline) into a single space:
>>> tables = camelot.read_pdf('doc.pdf', replace_text={' \n': ' '})
You can normalise unit names, expand abbreviations, or fix systematic OCR-style mistakes in the same call:
>>> tables = camelot.read_pdf(
...     'doc.pdf',
...     replace_text={'kw': 'kW', 'kva': 'kVA', 'µ': 'micro'},
... )
Keys are matched as literal substrings (regex metacharacters are escaped, so "." matches a literal dot). When several keys could match at the same position, the longest one wins, so {"abc": "X", "ab": "Y"} replaces "abc" with "X" rather than producing "Yc". Empty keys are ignored.
replace_text works with every flavor (lattice, stream, network, hybrid) and stacks cleanly with strip_text — stripping runs first, then replacement.
Per-page parameter overrides#
When a single PDF has pages with different table layouts — say a cover page with no table, two body pages with stream-flavour text columns, and an appendix with a ruled lattice table — calling read_pdf() once per page-group works but means re-opening the PDF and re-running parser setup each time.
The per_page keyword argument lets you keep the global kwargs and override just the ones that need to change for specific pages:
>>> tables = camelot.read_pdf(
...     'report.pdf',
...     pages='1-3',
...     flavor='stream',
...     split_text=True,
...     per_page={2: {'table_areas': ['120, 210, 400, 90']}},
... )
Here pages 1 and 3 use flavor='stream' with split_text=True. Page 2 uses both and the page-specific table_areas.
The per_page keys are 1-indexed page numbers (int or str). The values are dicts of any kwarg otherwise valid for read_pdf(), including a per-page flavor. Unknown kwargs and unknown flavors raise the same errors as if they were passed globally, named by their offending page.
Reading PDFs from memory#
Beyond filesystem paths and URLs, read_pdf() accepts in-memory PDF content directly: bytes, bytearray, an io.BytesIO, or any binary stream with a .read() method (an open "rb" file, a requests response’s .raw, etc.):
>>> import io, requests, camelot
>>>
>>> # Bytes you already have in memory
>>> data = open('doc.pdf', 'rb').read()
>>> camelot.read_pdf(data)
>>>
>>> # An io.BytesIO
>>> camelot.read_pdf(io.BytesIO(data))
>>>
>>> # Straight from an HTTP response
>>> resp = requests.get('https://example.org/doc.pdf')
>>> camelot.read_pdf(io.BytesIO(resp.content))
Camelot writes the bytes to a temporary file once internally (so the Lattice OpenCV image-conversion backend keeps working unchanged) and removes the temp file when the handler is closed. For file-like inputs the read position is preserved so the caller can keep using the same stream afterwards.
Improve guessed table areas#
While using Stream, automatic table detection can fail for PDFs like this one. That’s because the text is relatively far apart vertically, which can lead to shorter textedges being calculated.
Note
To know more about how textedges are calculated to guess table areas, you can see pages 20, 35 and 40 of Anssi Nurminen’s master’s thesis.
Let’s see the table area that is detected by default.
>>> tables = camelot.read_pdf('edge_tol.pdf', flavor='stream')
>>> camelot.plot(tables[0], kind='contour').show()
Tip
Here’s how you can do the same with the command-line interface.
$ camelot stream -plot contour edge_tol.pdf
To improve the detected area, you can increase the edge_tol (default: 50) value to counter the effect of text being placed relatively far apart vertically. Larger edge_tol will lead to longer textedges being detected, leading to an improved guess of the table area. Let’s use a value of 500.
>>> tables = camelot.read_pdf('edge_tol.pdf', flavor='stream', edge_tol=500)
>>> camelot.plot(tables[0], kind='contour').show()
Tip
Here’s how you can do the same with the command-line interface.
$ camelot stream -e 500 -plot contour edge_tol.pdf
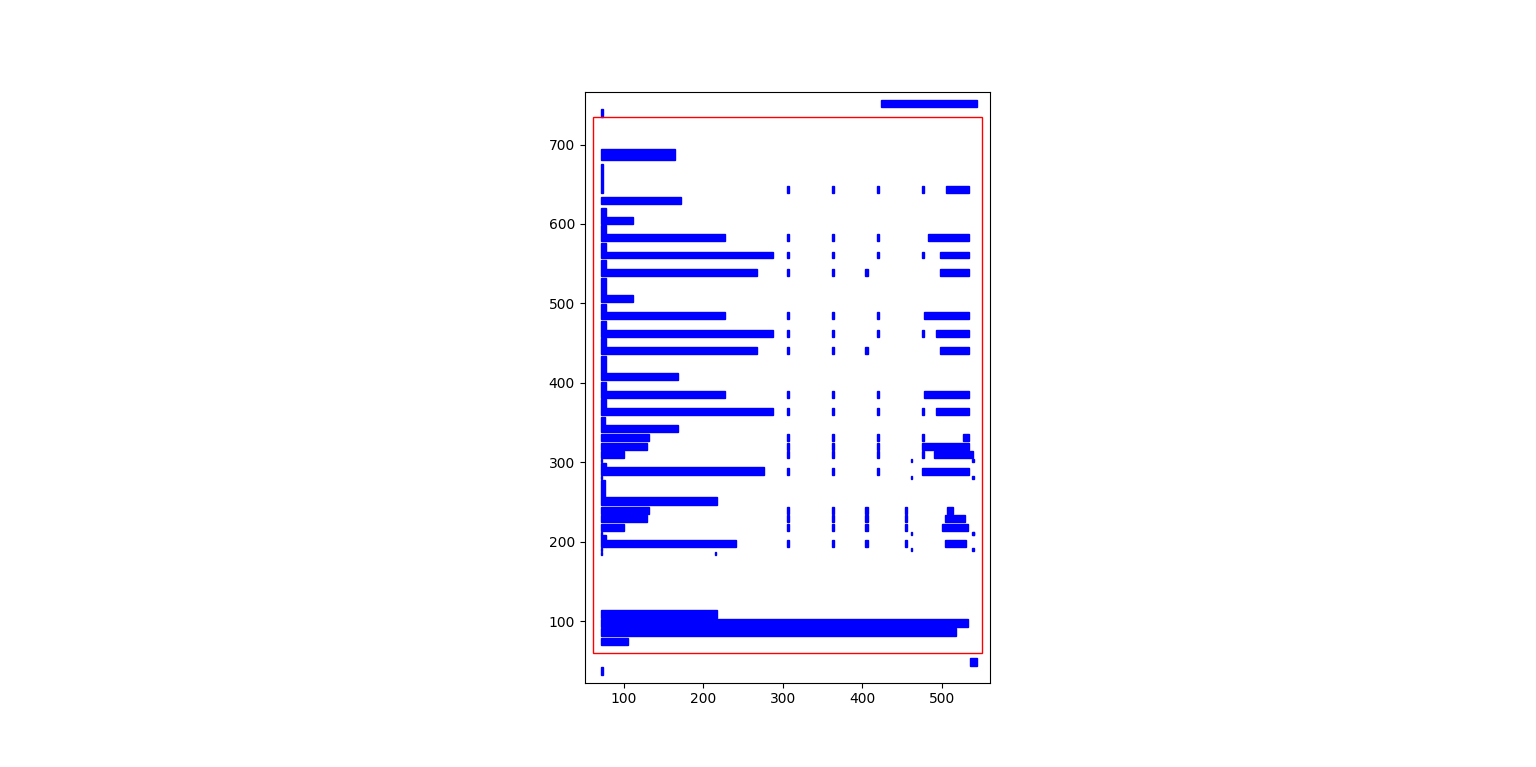
As you can see, the guessed table area has improved!
Improve guessed table rows#
You can pass row_tol=<+int> to group the rows closer together, as shown below.
>>> tables = camelot.read_pdf('group_rows.pdf', flavor='stream')
>>> tables[0].df
Clave |
Clave |
Clave |
||||
Nombre Entidad |
Nombre Municipio |
Nombre Localidad |
||||
Entidad |
Municipio |
Localidad |
||||
01 |
Aguascalientes |
001 |
Aguascalientes |
0094 |
Granja Adelita |
|
01 |
Aguascalientes |
001 |
Aguascalientes |
0096 |
Agua Azul |
|
01 |
Aguascalientes |
001 |
Aguascalientes |
0100 |
Rancho Alegre |
>>> tables = camelot.read_pdf('group_rows.pdf', flavor='stream', row_tol=10)
>>> tables[0].df
Tip
Here’s how you can do the same with the command-line interface.
$ camelot stream -r 10 group_rows.pdf
Clave |
Nombre Entidad |
Clave |
Nombre Municipio |
Clave |
Nombre Localidad |
|
Entidad |
Municipio |
Localidad |
||||
01 |
Aguascalientes |
001 |
Aguascalientes |
0094 |
Granja Adelita |
|
01 |
Aguascalientes |
001 |
Aguascalientes |
0096 |
Agua Azul |
|
01 |
Aguascalientes |
001 |
Aguascalientes |
0100 |
Rancho Alegre |
Detect short lines#
There might be cases while using Lattice when smaller lines don’t get detected. The size of the smallest line that gets detected is calculated by dividing the PDF page’s dimensions with a scaling factor called line_scale. By default, its value is 40.
As you can guess, the larger the line_scale, the smaller the size of lines getting detected.
Warning
Making line_scale very large (>150) will lead to text getting detected as lines.
Here’s a PDF where small lines separating the the headers don’t get detected with the value of 15.
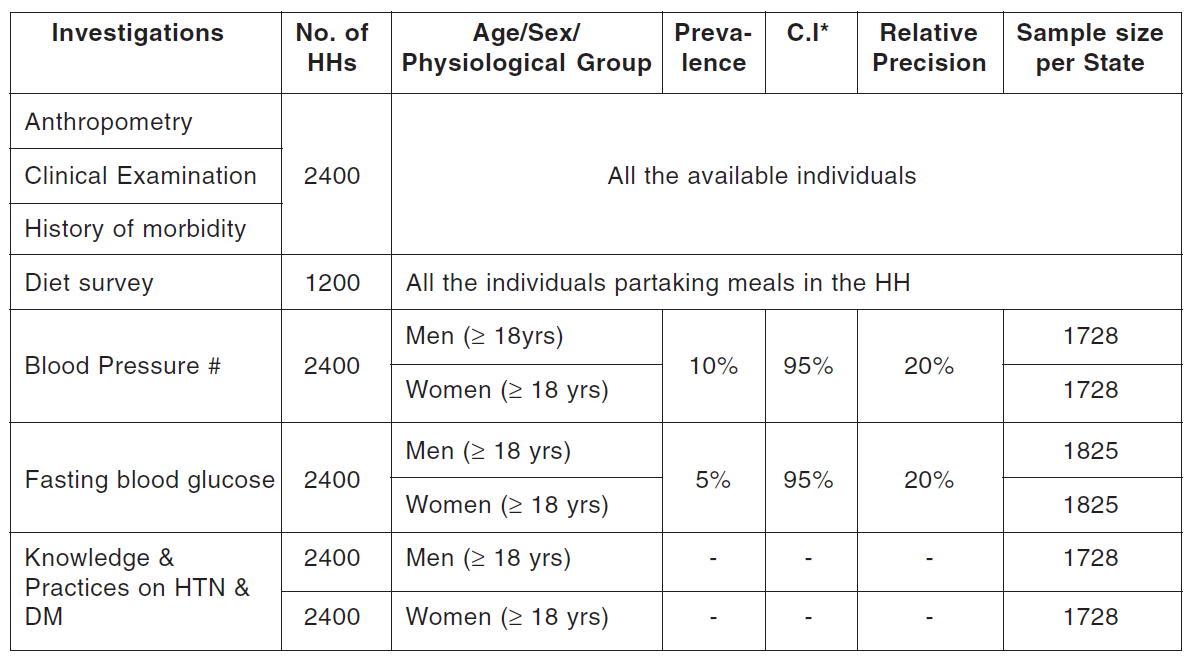
Let’s plot the table for this PDF.
>>> tables = camelot.read_pdf('short_lines.pdf')
>>> camelot.plot(tables[0], kind='grid').show()
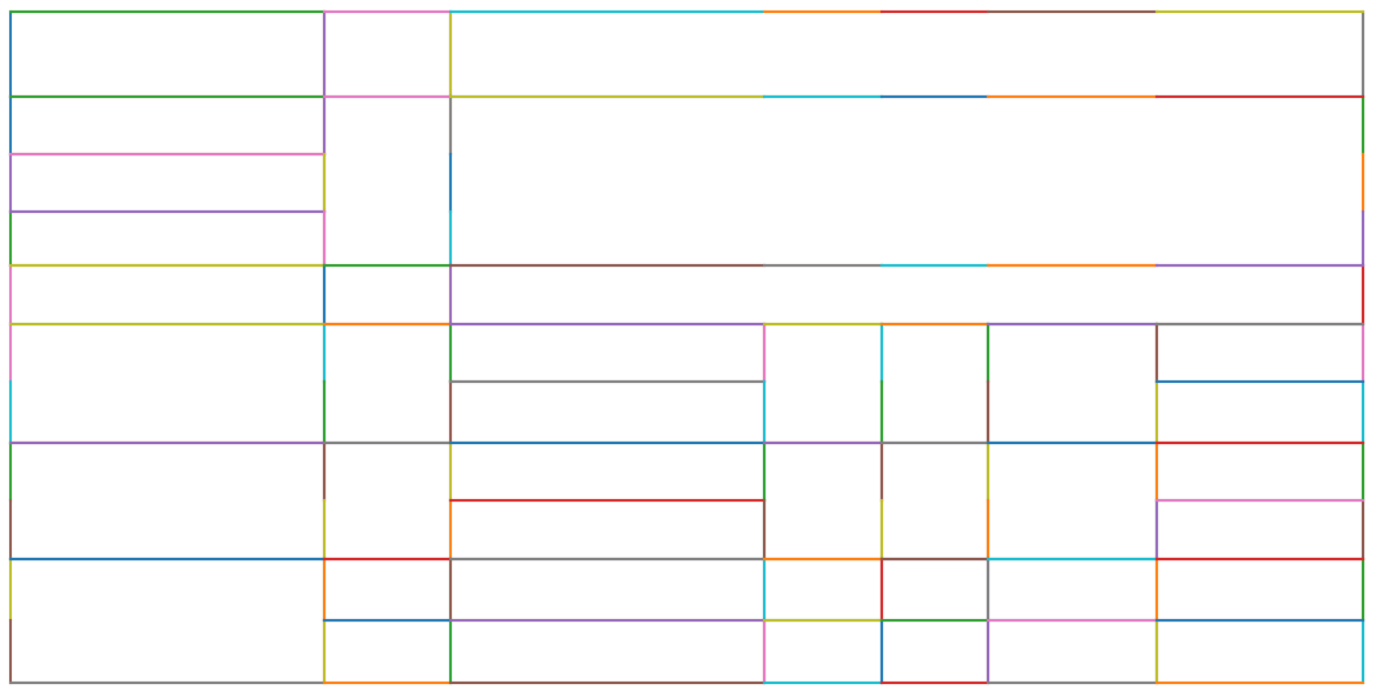
Clearly, the smaller lines separating the headers, couldn’t be detected. Let’s try with line_scale=40, and plot the table again.
>>> tables = camelot.read_pdf('short_lines.pdf', line_scale=40)
>>> camelot.plot(tables[0], kind='grid').show()
Tip
Here’s how you can do the same with the command-line interface.
$ camelot lattice -scale 40 -plot grid short_lines.pdf
Voila! camelot can now see those lines. Let’s get our table.
>>> tables[0].df
Investigations |
No. ofHHs |
Age/Sex/Physiological Group |
Preva-lence |
C.I* |
RelativePrecision |
Sample sizeper State |
Anthropometry |
2400 |
All … |
||||
Clinical Examination |
||||||
History of morbidity |
||||||
Diet survey |
1200 |
All … |
||||
Blood Pressure # |
2400 |
Men (≥ 18yrs) |
10% |
95% |
20% |
1728 |
Women (≥ 18 yrs) |
1728 |
|||||
Fasting blood glucose |
2400 |
Men (≥ 18 yrs) |
5% |
95% |
20% |
1825 |
Women (≥ 18 yrs) |
1825 |
|||||
Knowledge &Practices on HTN &DM |
2400 |
Men (≥ 18 yrs) |
1728 |
|||
2400 |
Women (≥ 18 yrs) |
1728 |
Shift text in spanning cells#
By default, the Lattice method shifts text in spanning cells, first to the left and then to the top, as you can observe in the output table above. However, this behavior can be changed using the shift_text keyword argument. Think of it as setting the gravity for a table — it decides the direction in which the text will move and finally come to rest.
shift_text expects a list with one or more characters from the following set: ('', l', 'r', 't', 'b'), which are then applied in order. The default, as we discussed above, is ['l', 't'].
We’ll use the PDF from the previous example. Let’s pass shift_text=[''], which basically means that the text will experience weightlessness! (It will remain in place.)
>>> tables = camelot.read_pdf('short_lines.pdf', line_scale=40, shift_text=[''])
>>> tables[0].df
Investigations |
No. ofHHs |
Age/Sex/Physiological Group |
Preva-lence |
C.I* |
RelativePrecision |
Sample sizeper State |
Anthropometry |
||||||
Clinical Examination |
2400 |
All … |
||||
History of morbidity |
||||||
Diet survey |
1200 |
All … |
||||
Men (≥ 18yrs) |
1728 |
|||||
Blood Pressure # |
2400 |
Women (≥ 18 yrs) |
10% |
95% |
20% |
1728 |
Men (≥ 18 yrs) |
1825 |
|||||
Fasting blood glucose |
2400 |
Women (≥ 18 yrs) |
5% |
95% |
20% |
1825 |
Knowledge &Practices on HTN & |
2400 |
Men (≥ 18 yrs) |
1728 |
|||
DM |
2400 |
Women (≥ 18 yrs) |
1728 |
No surprises there — it did remain in place (observe the strings “2400” and “All the available individuals”). Let’s pass shift_text=['r', 'b'] to set the gravity to right-bottom and move the text in that direction.
>>> tables = camelot.read_pdf('short_lines.pdf', line_scale=40, shift_text=['r', 'b'])
>>> tables[0].df
Tip
Here’s how you can do the same with the command-line interface.
$ camelot lattice -scale 40 -shift r -shift b short_lines.pdf
Investigations |
No. ofHHs |
Age/Sex/Physiological Group |
Preva-lence |
C.I* |
RelativePrecision |
Sample sizeper State |
Anthropometry |
||||||
Clinical Examination |
||||||
History of morbidity |
2400 |
All … |
||||
Diet survey |
1200 |
All … |
||||
Men (≥ 18yrs) |
1728 |
|||||
Blood Pressure # |
2400 |
Women (≥ 18 yrs) |
10% |
95% |
20% |
1728 |
Men (≥ 18 yrs) |
1825 |
|||||
Fasting blood glucose |
2400 |
Women (≥ 18 yrs) |
5% |
95% |
20% |
1825 |
2400 |
Men (≥ 18 yrs) |
1728 |
||||
Knowledge &Practices on HTN &DM |
2400 |
Women (≥ 18 yrs) |
1728 |
Copy text in spanning cells#
You can copy text in spanning cells when using Lattice, in either the horizontal or vertical direction, or both. This behavior is disabled by default.
copy_text expects a list with one or more characters from the following set: ('v', 'h'), which are then applied in order.
Let’s try it out on this PDF. First, let’s check out the output table to see if we need to use any other configuration parameters.
>>> tables = camelot.read_pdf('copy_text.pdf')
>>> tables[0].df
Sl. No. |
Name of State/UT |
Name of District |
Disease/ Illness |
No. of Cases |
No. of Deaths |
Date of start of outbreak |
Date of reporting |
Current Status |
… |
1 |
Kerala |
Kollam |
|
19 |
0 |
31/12/13 |
03/01/14 |
Under control |
… |
2 |
Maharashtra |
Beed |
|
11 |
0 |
03/01/14 |
04/01/14 |
Under control |
… |
3 |
Odisha |
Kalahandi |
|
42 |
0 |
02/01/14 |
03/01/14 |
Under control |
… |
4 |
West Bengal |
West Medinipur |
|
145 |
0 |
04/01/14 |
05/01/14 |
Under control |
… |
Birbhum |
|
199 |
0 |
31/12/13 |
31/12/13 |
Under control |
… |
||
Howrah |
|
85 |
0 |
26/12/13 |
27/12/13 |
Under surveillance |
… |
We don’t need anything else. Now, let’s pass copy_text=['v'] to copy text in the vertical direction. This can save you some time by not having to add this step in your cleaning script!
>>> tables = camelot.read_pdf('copy_text.pdf', copy_text=['v'])
>>> tables[0].df
Tip
Here’s how you can do the same with the command-line interface.
$ camelot lattice -copy v copy_text.pdf
Sl. No. |
Name of State/UT |
Name of District |
Disease/ Illness |
No. of Cases |
No. of Deaths |
Date of start of outbreak |
Date of reporting |
Current Status |
… |
1 |
Kerala |
Kollam |
|
19 |
0 |
31/12/13 |
03/01/14 |
Under control |
… |
2 |
Maharashtra |
Beed |
|
11 |
0 |
03/01/14 |
04/01/14 |
Under control |
… |
3 |
Odisha |
Kalahandi |
|
42 |
0 |
02/01/14 |
03/01/14 |
Under control |
… |
4 |
West Bengal |
West Medinipur |
|
145 |
0 |
04/01/14 |
05/01/14 |
Under control |
… |
4 |
West Bengal |
Birbhum |
|
199 |
0 |
31/12/13 |
31/12/13 |
Under control |
… |
4 |
West Bengal |
Howrah |
|
85 |
0 |
26/12/13 |
27/12/13 |
Under surveillance |
… |
Tweak layout generation#
Camelot is built on top of playa’s PDFMiner-compatible functionality for grouping characters on a page into words and sentences. In some cases (such as #170 and #215), the layout engine can group characters that should belong to the same sentence into separate sentences.
To deal with such cases, you can tweak the layout engine’s LAParams kwargs to improve layout generation, by passing the keyword arguments as a dict using layout_kwargs in read_pdf(). playa.miner mirrors PDFMiner.six’s LAParams, so the upstream PDFMiner.six docs still describe what each parameter does.
>>> tables = camelot.read_pdf('foo.pdf', layout_kwargs={'detect_vertical': False})
Use alternative image conversion backends#
When using the Lattice flavor, camelot uses pdfium to convert PDF pages to images for line recognition. You can still use ghostscript after installing it. You can specify which image conversion backend you want to use with
>>> tables = camelot.read_pdf(filename, backend="pdfium")  # default
>>> tables = camelot.read_pdf(filename, backend="ghostscript")
Note
ghostscript is replaced by pdfium as the default image conversion backend in v1.0.0.
If you face issues with pdfium, ghostscript and poppler, you can supply your own image conversion backend.
>>> class ConversionBackend(object):
>>>     def convert(pdf_path, png_path):
>>>         # read pdf page from pdf_path
>>>         # convert pdf page to image
>>>         # write image to png_path
>>>         pass
>>>
>>> tables = camelot.read_pdf(filename, backend=ConversionBackend())
Working with image-based / scanned PDFs#
Camelot extracts tables by reading the PDF’s text operators — fonts, positions, kerning. For PDFs that are image-only (scanned pages saved to PDF, faxed forms, photos exported to PDF) there is no text to read; every “table” is just pixels and Camelot will report zero tables found.
The recommended workflow is to add a text layer first, then run Camelot. OCRmyPDF is a mature, dedicated tool for exactly this — it wraps Tesseract OCR and overlays the recognised text on the original page images, so the output PDF reads exactly like the input but now has selectable, searchable, extractable text underneath.
Install once:
$ pipx install ocrmypdf # or: pip install ocrmypdf
…then run it in front of Camelot:
$ ocrmypdf scan.pdf scan-ocr.pdf
$ camelot lattice --output tables.csv scan-ocr.pdf
…or as a Python pipeline:
>>> import subprocess
>>> import camelot
>>> subprocess.run(["ocrmypdf", "scan.pdf", "scan-ocr.pdf"], check=True)
>>> tables = camelot.read_pdf("scan-ocr.pdf", flavor="lattice")
A few practical notes:
Mixed PDFs (some pages text, some scanned) are handled by default —
ocrmypdfwill skip pages that already have a text layer unless you pass--force-ocr.Languages other than English need the corresponding Tesseract language pack installed (e.g.
apt install tesseract-ocr-deufor German), thenocrmypdf -l deu scan.pdf scan-ocr.pdf.Table-friendly OCR benefits from a higher resolution and from preserving the original image.
ocrmypdf --image-dpi 300
--redo-ocr
is a reasonable default for documents whose scans are fuzzy.Quality: lattice-style ruled tables typically survive OCR well because the ruling lines are pixel-perfect; stream-style borderless tables depend heavily on how well Tesseract aligns the per-cell text — try
flavor="auto"orflavor="hybrid"and inspectTable.parsing_report(especially theconfidencefield) to pick the better path.
Why isn’t OCR built into Camelot? Tesseract is a heavyweight system
dependency (binary install + language packs, hundreds of MB), and
OCR quality is non-deterministic across versions — bundling it would
make the install story much worse for the majority of users who
already have text PDFs. Keeping OCR as a separate preprocessing step
lets ocrmypdf handle the OCR concerns (image preprocessing,
language detection, page rotation, etc.) and Camelot focus on the
post-OCR text-to-table conversion.